TEEM Platform endorses just transition for electric transportation
Imagine tomorrow, all vehicles in the world suddenly became battery powered. Would that achieve all our climate and environmental justice goals? Not exactly. What will help close the gap between equity and climate goals is an electrification transition that follows the principles of the Towards Equitable Eletric Mobility (TEEM) platform. Or, as one TEEM leader stated, “If you aren’t looking for the intersection, you aren’t going to find the solution.” Learn More at the Chicago... Read the rest of this entry »
H+T Series Part 3: So, What Else Can I Do With the H+T Index?
The main purpose of the H+T Index is to help users identify the most “location efficient” places across the United States by calculating the cost of housing as well as the cost of transportation to provide a more comprehensive understanding of the affordability of place. We learned through surveys and a series of interviews that the Housing, Transportation, and combined Housing + Transportation Cost metrics are regularly used to inform urban planning, governance, and policy decision making... Read the rest of this entry »
H+T Series Part 2: Why use a ‘Typical Regional Household’ to Highlight Location Efficiency?
The H+T® Affordability Index highlights location efficiency by using an “apples to apples” comparison of housing costs. What’s the Question? Users often ask why we use the median-income household in every block group in a metro area, pointing out that this misrepresents the actual costs for the households living there. The question goes to the heart of how our tool shows that living in compact and convenient area helps people stretch their budget. In a nutshell, the H+T Index is a... Read the rest of this entry »
H+T Affordability Index Blog Series
Introducing a series of blogs on CNT’s H+T Affordability Index – our most popular web tool. Nearly 20 years ago, CNT (Center for Neighborhood Technology) developed our Housing & Transportation, or H+T, Affordability Index. We theorized – and the data quickly proved -- that adding the two highest household costs, housing, and transportation, changes the way we look at household affordability. In other words, examining how location efficiency drives true affordability. The H+T Index is... Read the rest of this entry »
Southeast Side Climate Impacts: Quantitative data without community input misses the full story
Climate change impacts are felt by individuals and communities all over the world through intense or frequent storms, floods, and increased exposure to air and water pollutants. Who is most impacted by this? Unfortunately, those who are lower-income and have non-white racial or ethnic identities. Chicago’s Southeast Side is one of these communities. Here, residents experience health inequities from their proximity to industrial pollution, like higher rates of heart disease and respiratory... Read the rest of this entry »
CEJST is a simple map, with big implications – and attention to cumulative burdens matters.
The Climate and Economic Justice Screening tool, or CEJST for short, is a simple map, with big implications. CEJST identifies disadvantaged census tracts for prioritizing federal funding and informing Justice40, which aims to send “40 percent of the overall benefits of certain Federal investments… [to] disadvantaged communities that are marginalized, underserved, and overburdened by pollution. Over the next five years, federal and state agency staff are charged with doling out billions of... Read the rest of this entry »
Annual meeting of the Transportation Research Board (TRB) calls for adoption and implementation of equity goals – can IDOT deliver?
I had the pleasure of attending the annual meeting of the Transportation Research Board (TRB), which was held from January 8 through 12 in Washington D.C. A particularly poignant moment for me was during the Standing Committee on Equity in Transportation, when Irene Marion, Director of the Office of Civil Rights, and Ariel Gold, Senior Advisor at the Policy Office, presented the U.S. Department of Transportation (USDOT) Strategic Plan and the Equity Action Plan. The Strategic Plan includes... Read the rest of this entry »
CNT Celebrates Passage of Connected Communities Ordinance
Chicago is beautiful, vibrant and rich in arts and culture. So many corners of the globe are represented in the 77 neighborhoods that create the map of our City. The story of Chicago is the story of Indigenous Peoples, Immigrants, Migrants, and descendants of Enslaved Africans. It is also the story of segregation and redlining. It is a story of a City that was not designed for all of its citizens. To undo that legacy of disinvestment and inequity it takes boots on the ground, amplifying... Read the rest of this entry »
Fueling the Electric Vehicle Movement with Equity
This past week, as a member of the Toward Equitable Electric Mobility (TEEM) Illinois cohort, I had the pleasure of attending TEEM’s first in-person annual convening and Forth’s Roadmap Conference in Portland, Oregon. The electric vehicle sector is revved up and eager to expand in the face of the capital to be made and legacies to build, while simultaneously acting in response to climate change. Forth’s Roadmap Conference refocuses the lens, uplifting processes, projects, and... Read the rest of this entry »
CNT's Statement on Supreme Court Decisions
In just seven days, we have witnessed six Supreme Court Justices over turn 50 years of precedent, protection and shift power from the many, to the few. From the right for Women to have autonomy over their own Bodies, to Tribal Sovereignty, reading of Miranda Rights, Racial Redistricting and curbing the EPA’s power to limit greenhouse gas emissions. All of these decisions undermine the very fabric of what many people will celebrate this weekend, Independence and Freedom; leaving many Americans... Read the rest of this entry »


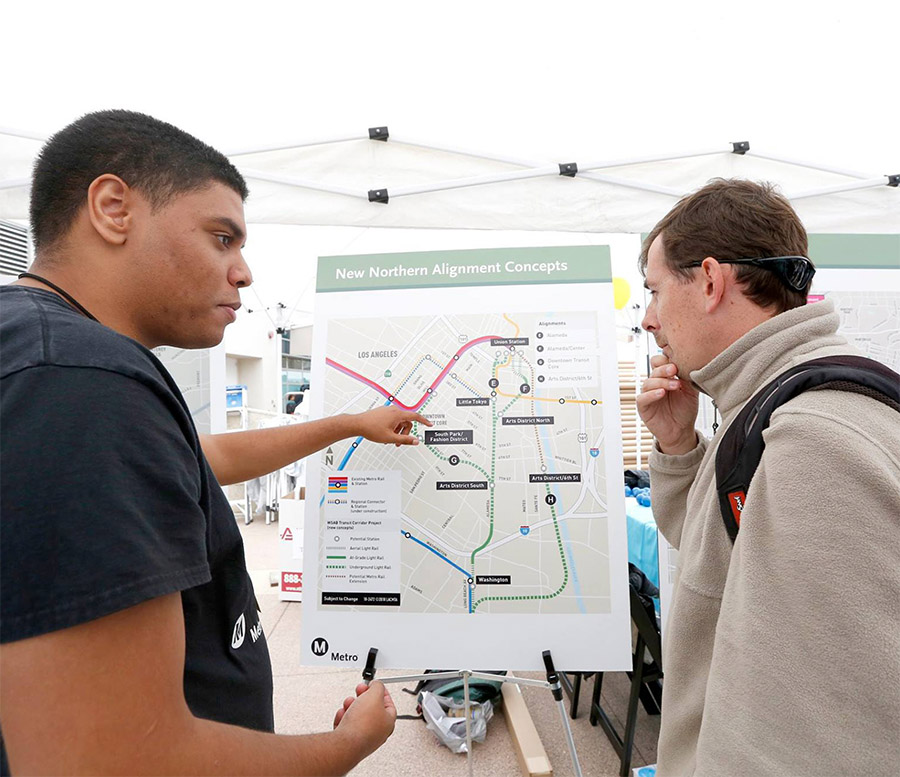
 Strengthening Transit Through Community Partnerships


 RSS Feed