


![]()

H+T Series Part 3: So, What Else Can I Do With the H+T Index?
The main purpose of the H+T Index is to help users identify the most “location efficient” places across the United States by calculating the cost of housing as well as the cost of transportation to provide a more comprehensive understanding of the affordability of place. We learned through surveys and a series of interviews that the Housing, Transportation, and combined Housing + Transportation Cost metrics are regularly used to inform urban planning, governance, and policy decision making... Read the rest of this entry »

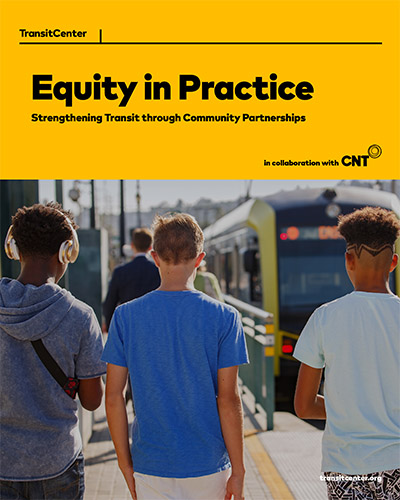
Strengthening Transit Through Community Partnerships
Transit agencies should continually interact with their riders and community members to ensure services meet their needs. Community engagement can take many forms, from agency staff hearing public comments on a finished project to working with constituents to design a plan or policy. Transit agencies often outsource this work to third-party consultants, who can be unfamiliar with the communities they are tasked to engage with. Since the mid-2010s, LA Metro has been refining a... Read the rest of this entry »

H+T Series Part 2: Why use a ‘Typical Regional Household’ to Highlight Location Efficiency?
The H+T® Affordability Index highlights location efficiency by using an “apples to apples” comparison of housing costs. What’s the Question? Users often ask why we use the median-income household in every block group in a metro area, pointing out that this misrepresents the actual costs for the households living there. The question goes to the heart of how our tool shows that living in compact and convenient area helps people stretch their budget. In a nutshell, the H+T Index is a... Read the rest of this entry »

H+T Affordability Index Blog Series
Introducing a series of blogs on CNT’s H+T Affordability Index – our most popular web tool. Nearly 20 years ago, CNT (Center for Neighborhood Technology) developed our Housing & Transportation, or H+T, Affordability Index. We theorized – and the data quickly proved -- that adding the two highest household costs, housing, and transportation, changes the way we look at household affordability. In other words, examining how location efficiency drives true affordability. The H+T Index is... Read the rest of this entry »

Annual meeting of the Transportation Research Board (TRB) calls for adoption and implementation of equity goals – can IDOT deliver?
I had the pleasure of attending the annual meeting of the Transportation Research Board (TRB), which was held from January 8 through 12 in Washington D.C. A particularly poignant moment for me was during the Standing Committee on Equity in Transportation, when Irene Marion, Director of the Office of Civil Rights, and Ariel Gold, Senior Advisor at the Policy Office, presented the U.S. Department of Transportation (USDOT) Strategic Plan and the Equity Action Plan. The Strategic Plan includes... Read the rest of this entry »


H+T Affordability Index October 2022 Update
CNT’s H+T® Affordability Index has just been updated, the first update since 2016. For most households in the United States, housing and transportation represent the largest and second-largest expenditures respectively. The H+T Affordability Index combines housing and transportation (driving and transit) costs to offer an expanded view of affordability, one that highlights the importance of location-efficient places in supporting livability and affordability. In this update we... Read the rest of this entry »


CNT Celebrates Passage of Connected Communities Ordinance
Chicago is beautiful, vibrant and rich in arts and culture. So many corners of the globe are represented in the 77 neighborhoods that create the map of our City. The story of Chicago is the story of Indigenous Peoples, Immigrants, Migrants, and descendants of Enslaved Africans. It is also the story of segregation and redlining. It is a story of a City that was not designed for all of its citizens. To undo that legacy of disinvestment and inequity it takes boots on the ground, amplifying... Read the rest of this entry »

Fueling the Electric Vehicle Movement with Equity
This past week, as a member of the Toward Equitable Electric Mobility (TEEM) Illinois cohort, I had the pleasure of attending TEEM’s first in-person annual convening and Forth’s Roadmap Conference in Portland, Oregon. The electric vehicle sector is revved up and eager to expand in the face of the capital to be made and legacies to build, while simultaneously acting in response to climate change. Forth’s Roadmap Conference refocuses the lens, uplifting processes, projects, and... Read the rest of this entry »

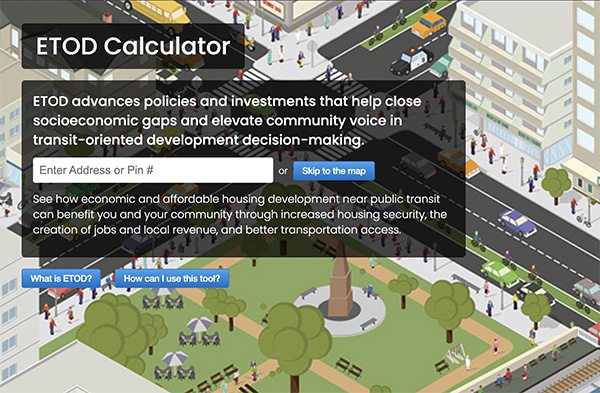
The New and Improved ETOD Calculator
What is ETOD and Why it Matters CNT has been advocating for transit oriented development (TOD) for more than 25 years. TOD looks like dense, pedestrian-friendly, mixed-use projects near train stops that allow people to use transit to access multiple needs like housing, jobs, education, shopping, healthcare etc, reducing their time spent on travel and reducing greenhouse gas emissions. However, as TOD has been rolled out, many Black and Brown, low-income communities have been either... Read the rest of this entry »

Rising Gas Prices and Total Diving Costs
Since 2008, when gas prices reached record highs, CNT’s H+T Affordability Index has highlighted the impacts of gas prices on household transportation costs. The Total Driving Costs tool allows users to slide the gas price up or down and see how volatility in the price at the pump impacts communities differently. The H+T Affordability Index has long shown that the old “Drive Till You Qualify” real estate mantra fails to capture the higher transportation costs that accompany the... Read the rest of this entry »
 RSS Feed