


View this page in Spanish: click here
CNT and Elevate Energy are working with the City of Evanston on a unique program exploring options to achieve affordable, resilient, net-zero homes.
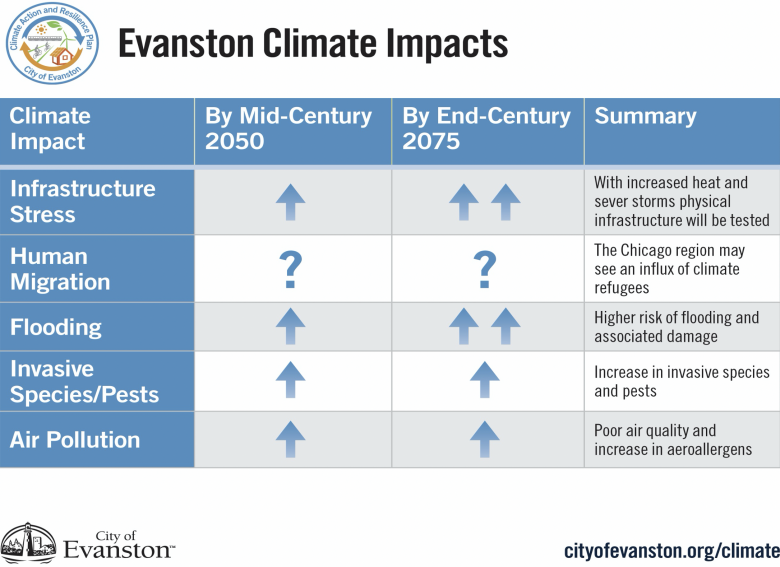
To achieve Evanston’s carbon neutrality goals, steep reductions in emissions from existing buildings are necessary, coupled with policies that reduce vulnerability of buildings to local climate hazards - extreme heat and flooding.
Previous racially-motivated policies – exacerbated by the mortgage foreclosure crisis and 2008 economic recession – have reinforced racial segregation, making it difficult for residents to access affordable housing, let alone housing that is energy efficient, uses clean energy, and resilient to climate hazards. People of color disproportionately bear the burden of unaffordable housing in Evanston.
The project aims to uncover solutions to renovate existing affordable housing, while remaining affordable to low- and moderate-income residents after the renovation.
This work is a first step in a comprehensive effort to transition homes in Evanston to a climate resilience and net-zero emissions standard while maintaining affordability.
Learn more about Evanston's Climate Action and Resilience Plan here.
Key Definitions
Equity – Racial equity is achieved when racial identity is no longer a predictor of life outcomes. Learn more about Evanston’s commitment to end structural racism and achieve racial equity.
Affordable Housing – Housing available to those with a median household income at or below 120% of area median income (AMI), with a focus on households below 80% of AMI. Affordable housing may be either income-qualified, or “naturally occurring” housing that is rented or mortgaged at an affordable cost. This project prioritizes buildings that house low-income residents and/or people of color.

Net-Zero Building – Highly energy efficient housing, where the amount of energy used by the building equals the amount of clean energy produced, either at the building or off-site. Clean energy examples include rooftop solar and community solar. Energy from non-renewable sources, such as natural gas, creates greenhouse gas emissions that drive climate change impacts.
80% of Evanston’s greenhouse gas emissions are produced by buildings.
Climate Resilient Housing – Housing that reduces vulnerability of residents to climate impacts, such as utility expenses, indoor health quality, and building integrity. Climate data indicates that Evanston may experience more extremely hot days and severe storms, which could cause impacts such as heat-related illness and home flooding.
Vulnerability Assessments
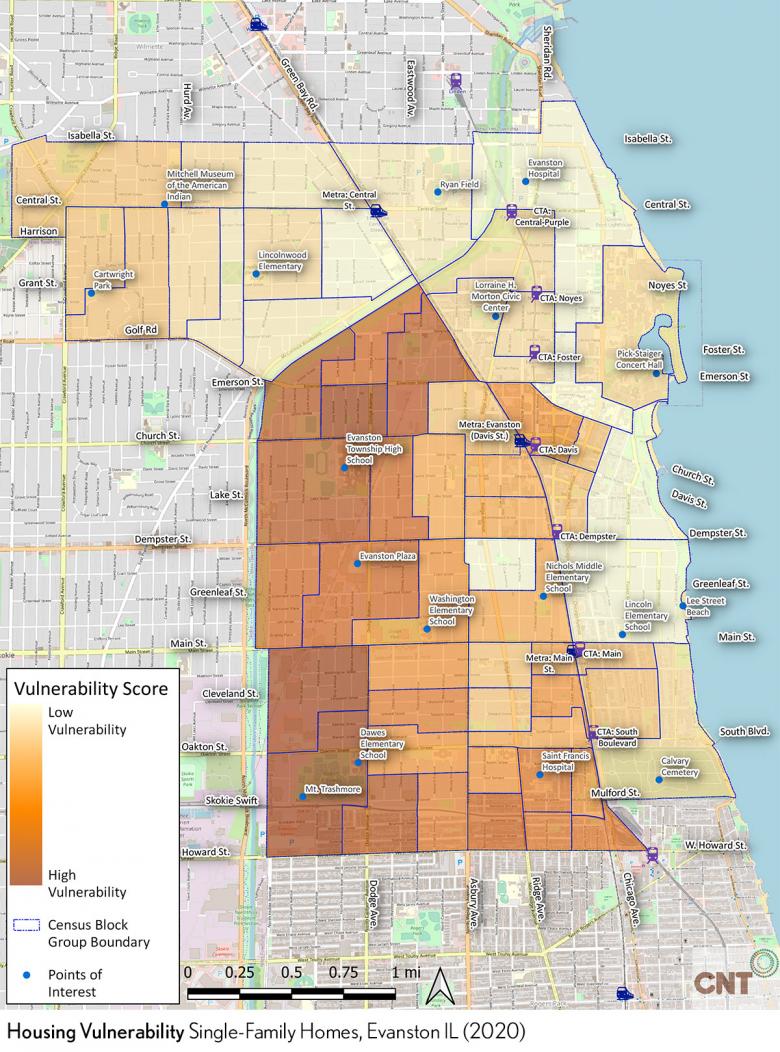
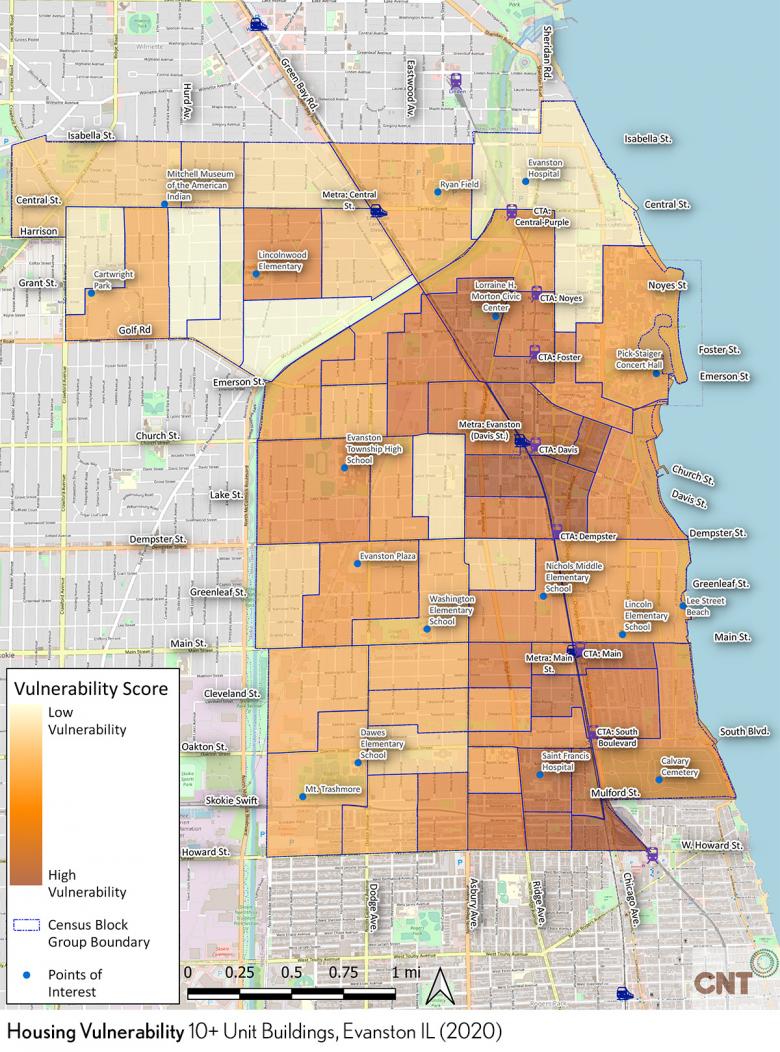
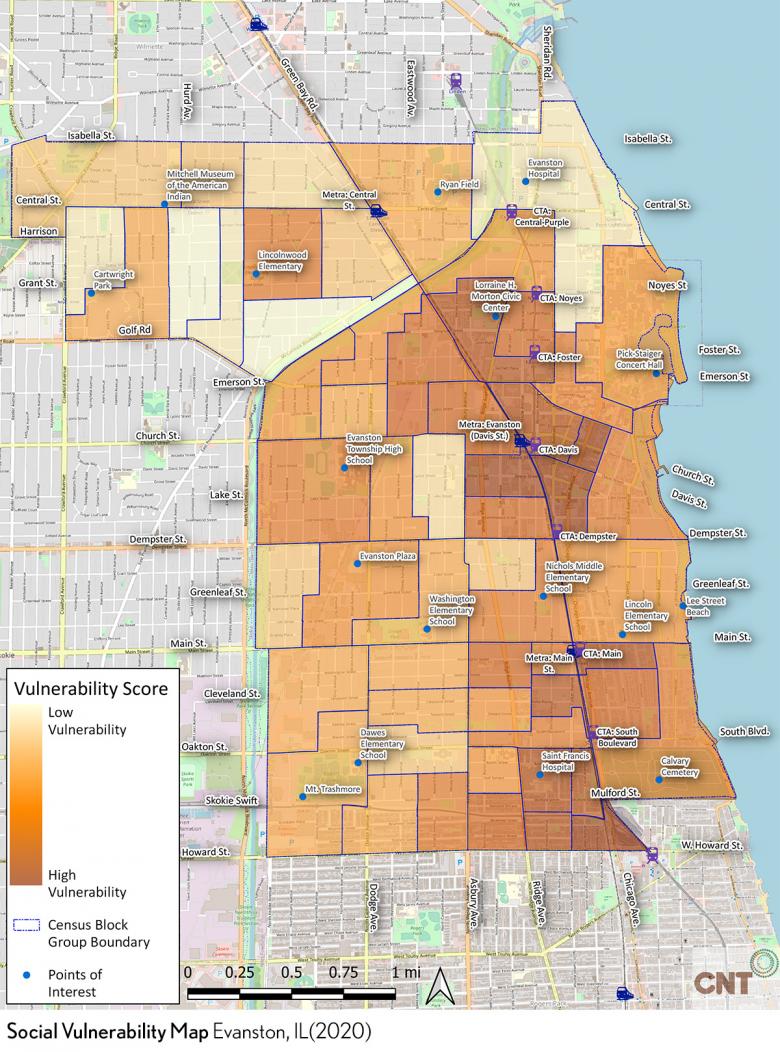
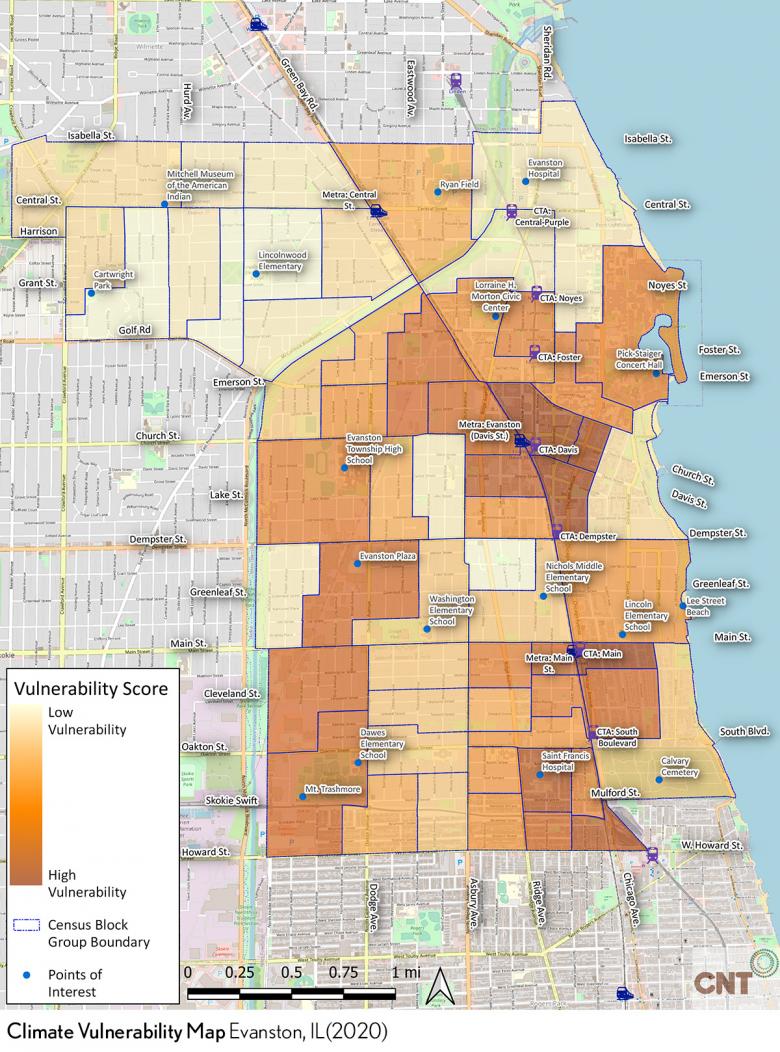
These maps illustrate the degree to which Evanston’s housing affordability is threatened by climate change and gentrification. The Vulnerability Score is based on climate, housing and social conditions. Property values are used to represent housing affordability. Darker brown areas are more vulnerable.
Example: To understand how the vulnerability score is calculated, let’s consider two different areas - Example Area 1 and Example Area 2. Area 1 has very few street trees, many lower income families and many homes with relatively low property values. Area 2 has many trees, many high-income residents and many homes with high property values. Therefore, Example Area 1 would have a higher vulnerability score than Example Area 2.
Housing Vulnerability Maps


Social & Climate Vulnerability Maps
Housing Vulnerability
Single Family Homes, Evanston IL (2020)

A map of Evanston, Illinois with census block group boundaries outlined. The map presents the housing vulnerability for single family homes in each census block. Housing vulnerability indicates how vulnerable homes are to combined impacts from combined impacts from combined impacts from climate change, social factors, and gentrification. Census blocks in the upper Northwest of Evanston and bordering Lake Michigan are a light yellow to orange hue. Census blocks in the center and lower Southwest of Evanston are a tan to dark brown hue. A legend to the left indicates a light yellow to dark brown spectrum for indicating vulnerability. The lighter the hue, the lower the vulnerability. The darker the hue, the higher the vulnerability.
Housing Vulnerability
2-4 Unit Buildings, Evanston IL (2020)
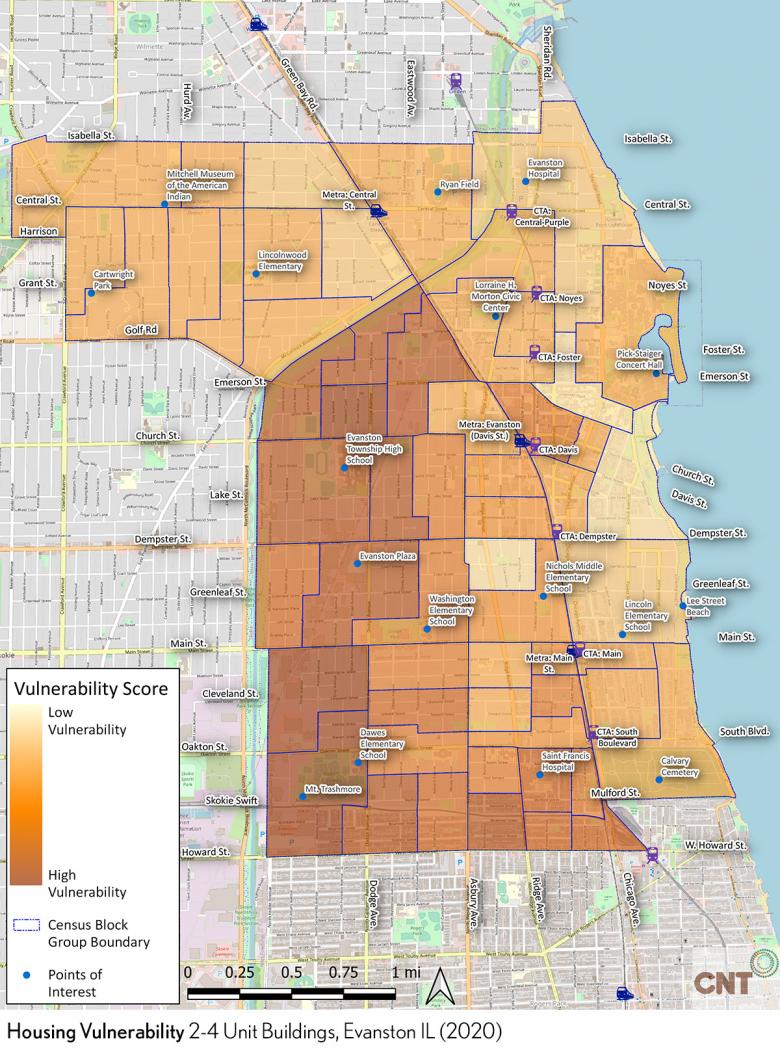
A map of Evanston, Illinois with census block group boundaries outlined. The map presents the housing vulnerability for 2-4 unit buildings in each census block. Housing vulnerability indicates how vulnerable homes are to combined impacts from climate change, social factors, and gentrification. Census blocks in the upper Northwest of Evanston are mostly a light orange hue with lighter shades of orange in blocks bordering Lake Michigan. Census blocks in the Southwest of Evanston are a mostly a dark brown hue, with census blocks in the center having an orange hue. A legend to the left indicates a light yellow to dark brown spectrum for indicating vulnerability. The lighter the hue, the lower the vulnerability. The darker the hue, the higher the vulnerability.
Housing Vulnerability
5-9 Unit Buildings, Evanston IL (2020)
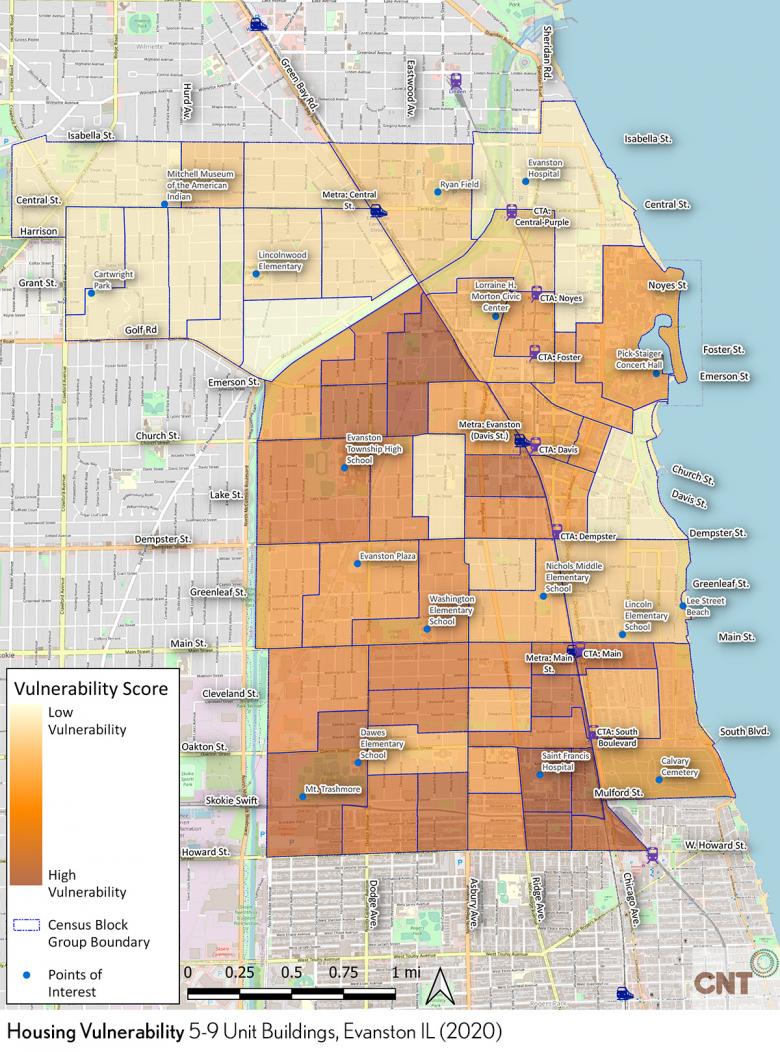
A map of Evanston, Illinois with census block group boundaries outlined. The map presents the housing vulnerability for 5-9 unit buildings in each census block. Housing vulnerability indicates how vulnerable homes are to impacts from climate change, social factors, and gentrification. Census blocks in the upper Northwest of Evanston are mostly a light yellow hue with some having a peach hue. Census block bordering Lake Michigan are diverse in hue: the Northern-most block and a block located in the central region of Evanston are a light shade of yellow, with the remaining blocks near the lake having an orange hue. Census blocks in the center and Southwest of Evanston range from orange to dark brown, with no cluster of any particular hue. A legend to the left indicates a light yellow to dark brown spectrum for indicating vulnerability. The lighter the hue, the lower the vulnerability. The darker the hue, the higher the vulnerability.
Housing Vulnerability
10+ Unit Buildings, Evanston IL (2020)

A map of Evanston, Illinois with census block group boundaries outlined. The map presents the housing vulnerability for 10+ unit buildings in each census block. Housing vulnerability indicates how vulnerable homes are to impacts from climate change, social factors, and gentrification. Census blocks in the upper Northwest of Evanston are a range of light yellow to dark orange. The most Northern census block bordering Lake Michigan is a light shade of yellow, and remaining census blocks bordering the lake are all an orange hue. Census blocks in the center and Southeast of Evanston range from light yellow to dark brown with no cluster of any particular hue. The Southwest of Evanston is consistently an orange hue, with some being slightly lighter than others. A legend to the left indicates a light yellow to dark brown spectrum for indicating vulnerability. The lighter the hue, the lower the vulnerability. The darker the hue, the higher the vulnerability.
Social Vulnerability
Evanston IL (2020)

A map of Evanston, Illinois with census block group boundaries outlined. The map presents the social vulnerability of each census block. Social vulnerability indicates how vulnerable homes are to impacts from social factors such as lower household income. Census blocks in the upper Northwest of Evanston are a range of light yellow to orange. The most Northern census block bordering Lake Michigan is a light shade of yellow, and remaining census blocks bordering the lake are all an orange hue. Census blocks in the center and Southeast of Evanston range from light yellow to dark brown, with no cluster of one particular hue, and only two light yellow blocks. The Southwest region of Evanston is consistently an orange hue, with some being slightly lighter than others. The far Southwestern corner of Evanston is mostly a light orange hue. A legend to the left indicates a light yellow to dark brown spectrum for indicating vulnerability. The lighter the hue, the lower the vulnerability. The darker the hue, the higher the vulnerability.
Climate Vulnerability
Evanston IL (2020)

A map of Evanston, Illinois with census block group boundaries outlined. The map presents the climate vulnerability of each census block. Climate vulnerability indicates how vulnerable homes are to impacts from climate change. Census blocks in the upper Northwest of Evanston are a range of light to pale yellow hues. The most Northern census block bordering Lake Michigan is a light shade of yellow, whereas the remaining bordering blocks range from dark orange (located right under the Northern-most block) to variations of light yellow to orange hues. Census blocks in the center and Southeast of Evanston range from light yellow to dark brown with only two light yellow blocks to the left of the CTA Purple train line. The far Southwestern corner of Evanston is a cluster of light to dark orange hues. The Southwest region of Evanston is consistently an orange hue, with one light yellow block that borders Greenleaf St. A legend to the left indicates a light yellow to dark brown spectrum for indicating vulnerability. The lighter the hue, the lower the vulnerability. Rhe darker the hue, the higher the vulnerability.
Project Team
City of Evanston
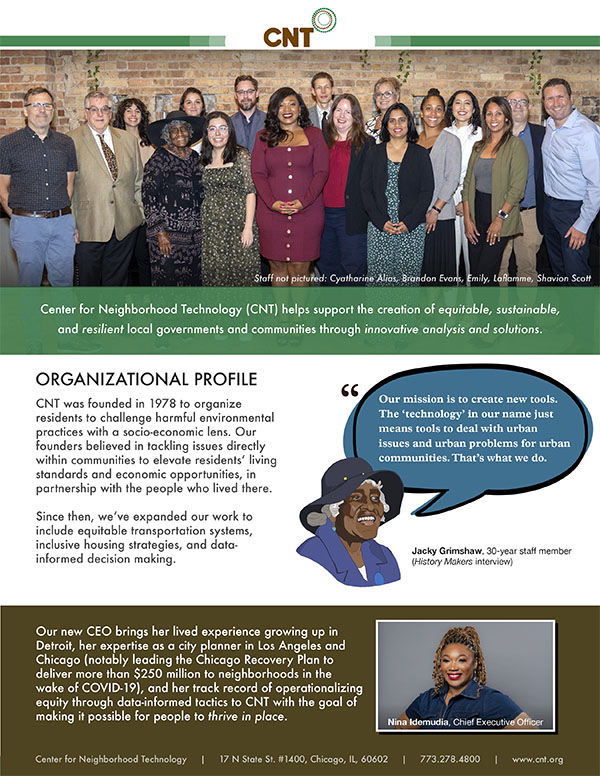
Center for Neighborhood Technology (CNT)
Elevate Energy
MUSE Community + Design
Project Funders
This project is generously supported by Chicago Community Trust, Evanston Community Foundation, and Partners for Places - a project of the Funders’ Network for Smart Growth and Livable Communities.