How socially conscious is your city?
What does "socially conscious" even mean?
It’s more than just a euphemism for having left-leaning political views (sorry, Urban Dictionary).
"Social consciousness asks us to recognize the inherent connection between us all," Kirsten Helgeson, founder and CEO of Just A Girl, a company that drives mental health and women’s empowerment efforts, told The Ascent.
This awareness -- at individual and institutional levels -- helps account for the needs of a city's residents. That's what it means to live in a community. Without it, people are isolated and more likely to be depressed, anxious, or violent.
"Social consciousness . . . makes one attuned, responsive, and sensitive to the needs and problems of society or the societies in which they live, work, and operate," said Terrell Strayhorn, Professor of Urban Education at LeMoyne-Owen College and CEO of Do Good Work LLC, in an email to The Ascent.
"Yes, it’s about awareness, but awareness is not enough. It’s a consciousness that calls one to action, duty, and responsibility. Social consciousness is important because we cannot change things we do not see, pay attention to, or [that we] subconsciously ignore," Strayhorn adds.
We couldn’t agree more, so we wanted to highlight how America’s largest cities are doing when it comes to social consciousness.
How we ranked American cities' social consciousness
We looked at seven factors to create a composite score for each city on our list:
Equality consists of measures of racial, gender, and LGBTQ equality.
Neighborliness consists of volunteering and crime rates, proportion of homeless population that's sheltered, and immigrant-friendliness.
The cost of childcare measures the monthly cost of full-time care for two children.
Sustainability represents a city's progress toward the United Nations' Sustainable Development Goals.
Food access measures the number of people who live more than one mile from a grocery store in an urban area or more than 10 miles in a non-urban area.
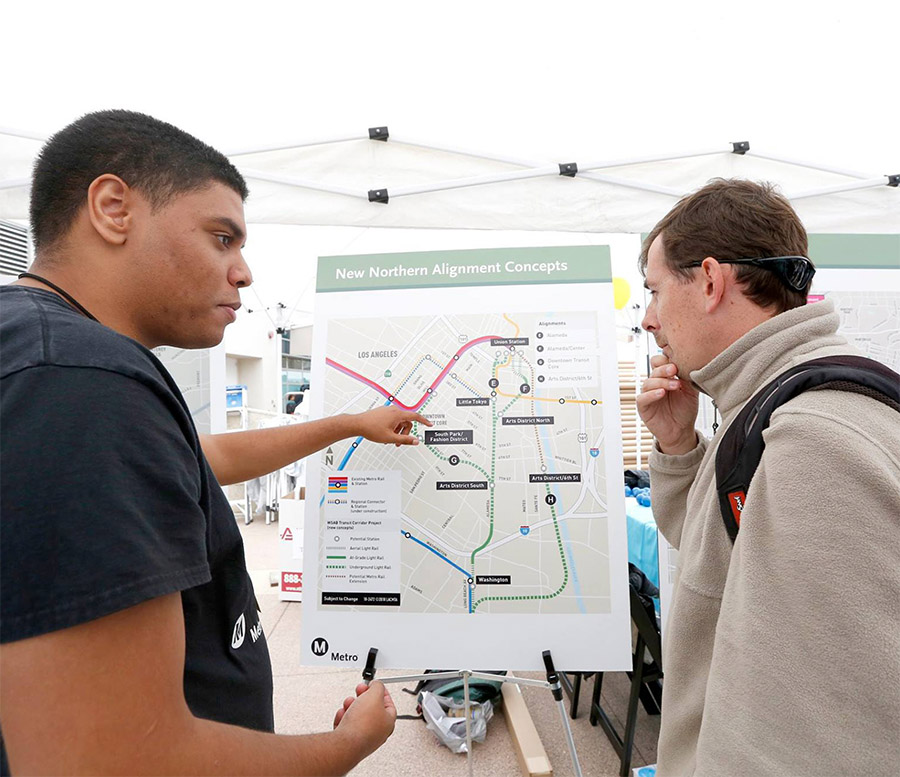
Public transit includes measures of connectivity, access to jobs, and frequency of service.
The cost of healthcare is a huge issue in the United States, and is one of the pressing social problems of our time.
These dimensions represent some of the most important social issues in American life. Of course, we couldn't include every social issue that we could think of -- there's just not data to support that. We chose these seven factors (consisting of 12 points of data) to create the best approximation possible. When we update these rankings next year, we'll do our best to include even more socially relevant factors.
To determine each city's category score, we used the following formula to convert the original data to a score on a 100-point scale:
[city's score] - [lowest score] / [highest score - lowest score] * 100
Then we summed the category scores to get a total score out of 700.
Methodology
To get a rough measure of each city's social consciousness, we used the sum of seven factors. Each factor, detailed below, was transformed into a rating between zero and 100. In most cases, the highest value on any scale was converted to 100, while the lowest was converted to zero (in some cases, such as healthcare cost, the opposite is true).
Then we totaled each city's scores to get their final score out of 700.
Unfortunately, not every city had data points for every factor. If a city was missing more than two data points, we left it out of the ranking. We know this isn't totally fair to every city, but we also didn't want to use the average score and let some cities slide by on one or two really high numbers. In the end, this seemed like the most balanced way to deal with cities that didn't show up in all of the datasets we referenced.
Here's how we calculated each factor:
Equality
To develop our equality score, we used three sources: Governing.com’s black-white dissimilarity index, the 2018 American Community Survey’s gender pay gap (table S2411), and the Human Rights Campaign’s Municipal Equality Index. We averaged the transformed values of all three to create the equality score for each city.
The black-white dissimilarity index looks at "how evenly distributed demographic groups are throughout a larger area." While some cities might be more accurately classified by other racial comparisons, this was the most available statistic for racial equality in large cities.
The Human Rights Campaign’s Municipal Equality Index measures LGBTQ inclusivity based on "non-discrimination laws, the municipality as an employer, municipal services, law enforcement, and the city leadership's public position on equality."
The Census Bureau's American Community Survey shows women’s pay as a percentage of men’s at multiple levels, including metro areas.
Neighborliness
We used four sources to develop our neighborliness score: volunteering rate, crime rate, proportion of homeless who are sheltered, and immigrant friendliness. After transforming each item into a 0–100 value, we averaged all four to get the neighborliness score.
The National Service Agency calculated volunteering rates using three to four years of pooled data leading up to 2015. The survey ranks large and mid-size cities using data from a national survey.
To measure crime rates, we used the FBI’s 2018 Crime in the United States report. Ranking cities by crime rate is a fraught practice; the FBI cautions against using its data to rank locales because factors as diverse as population density, youth population, climate, crime reporting practices, economic conditions, modes of transportation, and cultural and religious factors can affect crime statistics. By combining this measure with three others to produce our neighborliness score, we deemphasize its importance in our ratings while still acknowledging that crime matters.
The proportion of the homeless population that is sheltered comes from the U.S. Department of Housing and Urban Development, which conducts a point-in-time count of homeless individuals on one night every January. We used the most recent results from the January 2019 survey.
Unsheltered homelessness has risen over the last five years as the number of emergency beds and transitional housing units has declined. More than half a million Americans were homeless in 2019, and 37% were unsheltered, meaning they were staying on the street, in abandoned buildings, or in similarly inhospitable places. While only 13% of the U.S. population is African American, 40% of the homeless population is.
We used the New American Economy (NAE) Cities Index to measure a city’s friendliness to immigrants. The Index looks at numerous factors in each city that affect immigrants, such as language support, immigrant-focused government and community services, and anti-wage-theft laws, along with the median income immigrants earn, their naturalization rate, and much more.
Childcare cost
The Economic Policy Institute measures the income a family needs to attain a modest standard of living. One measure in its Family Budget Calculator, published in March 2018 and based on 2016 data, is the cost of child care for a two-child family.
It assumes that one child is four years old and needs full-time, year-round care and the other child is eight years old and needs nine months of before- and after-school care and two months of full-time summer care. EPI also assumes the family uses center-based rather than home-based care.
Sustainability
The 2019 U.S. Cities Sustainable Development Report ranks 105 U.S. cities on their progress toward meeting each of the UN’s 16 Sustainable Development Goals for 2030. The score ranks 57 indicators per city that contribute to goals such as clean water and sanitation, affordable and clean energy, and zero hunger.
Food access
The United States Department of Agriculture’s Economic Research Service produces a 275-variable Food Environment Atlas examining factors such as access and proximity to a grocery store (with subcategories for access by low-income households, seniors, and children), Supplemental Nutrition Assistance Program (SNAP) recipients, and household food insecurity. It was last updated in March 2018.
Public transit
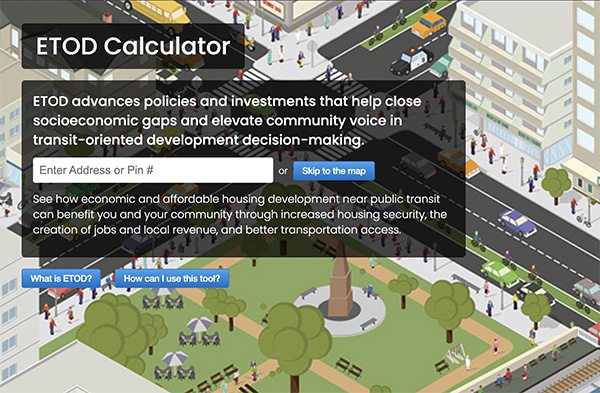
To score cities on public transit, we used the AllTransit Performance Score, which looks at availability and frequency of service, connectivity to jobs, coverage area, and the percent of commuters who take transit to work. The Center for Neighborhood Technology assembles and analyzes this data.
Healthcare cost
The Robert Wood Johnson Foundation’s Healthy Marketplace Index provides the basis for our health care cost scores. This index is based on an analysis of 1.8 billion health care claims from 2012 through 2016 for individuals with commercial health insurance.
The 10 most socially conscious U.S. cities
Using the seven metrics above, we’ve identified the 10 most socially conscious cities in the United States. These cities provide examples for others to follow -- but even the best cities have room to improve.
Here are the category and overall scores for the top 10 cities. We'll start with #10 and work our way down to the most socially conscious city in the country at #1.

 Strengthening Transit Through Community Partnerships

