


The traditional measure of affordability recommends that housing cost no more than 30% of household income. Under this view, a little over half (55%) of U.S. neighborhoods are considered “affordable” for the typical household. However, that benchmark fails to take into account transportation costs, which are typically a household’s second-largest expenditure. When transportation costs are factored into the equation, the number of affordable neighborhoods drops to 26%, resulting in a net loss of 59,768 neighborhoods that Americans can truly afford.
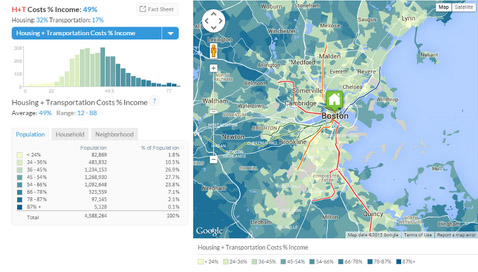
The H+T Index offers an expanded view of affordability, one that combines housing and transportation costs and sets the benchmark at no more than 45% of household income.
H+T presents housing and transportation data as maps, charts and statistics for 917 metropolitan and micropolitan areas—covering 94% of the U.S. population. Costs can be seen from the regional down to the neighborhood level.
The Index shows that transportation costs vary between and within regions depending on neighborhood characteristics. People who live in location-efficient neighborhoods—compact, mixed-use, and with convenient access to jobs, services, transit and amenities—tend to have lower transportation costs.