


The main purpose of the H+T Index is to help users identify the most “location efficient” places across the United States by calculating the cost of housing as well as the cost of transportation to provide a more comprehensive understanding of the affordability of place. We learned through surveys and a series of interviews that the Housing, Transportation, and combined Housing + Transportation Cost metrics are regularly used to inform urban planning, governance, and policy decision making. But we also learned many users of the tool aren't considering or are aware of the 30+ additional metrics and other useful features available to help examine the characteristics of a place.
This blog covers several of those metrics and highlights a few useful pro-tips some users may not have discovered on their own. Some of what is covered in this post is explained in greater detail in the H+T user guide, but this blog focuses on the breadth of possibilities without going into the “how-to” that’s already covered there. If you're late to the party, our introduction to the H+T blog series covers how housing and transportation costs are calculated and why location efficiency drives true affordability.
Pick a Metric, Any Metric!
The H+T Index provides 37 metrics for the user to map and explore at various geographical levels. By default, the map and data shown is the Housing and Transportation Costs as a percent of Household Income, but you can view additional metrics by clicking the blue drop-down menu next to the map:

Once you expand the drop-down menu, you’ll see everything that goes into calculating the index, including the components of the index itself (the H and the T).
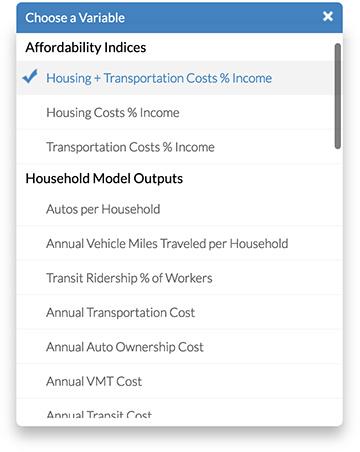
Scroll through to choose any of the variables which are grouped by category:
- Affordability Indices (3 metrics)
- Household Model Outputs (8)
- Greenhouse Gas from Household Auto Use (2)
- Composite Neighborhood Scores (3)
- Environmental Characteristics (13)
- Household Characteristics (3)
- Housing Costs (5)
The H+T Methodology provides a thorough documentation of the variables and modeling behind the H+T calculations or you can hover over a tooltip question mark placed alongside a metric's name for a brief definition. But let’s look at a few of them here and what they could be used for:
Household Model Outputs
Autos per Household: Autos per Household models the average number of vehicles owned by households, as modeled for the typical household, within the Block Group.
Potential uses: Auto ownership is typically the number one transportation cost component, this will map the most/least car depenct places.
Annual Transit Trips: Average Annual Transit Trips as modeled for the typical household. This is calculated using the transit agencies total trips provided, allocated to all the Census Block Groups they provide service to, proportiatly using the number of households and the modeled transit ridership % of workers.
Potential uses: While a lot of transit trips are used for the jourey to work and back there are a lot of other reasons people use transit. This metric is an estimate of all of those transit trips. By examining this the user can find locations where transit works the best, for any number of reasons. And could be used to find locations where transit could be improved.
Greenhouse Gas from Household Auto Use
Annual GHG per Household: Greenhouse gas emissions from household auto use are calculated using the modeled values for Vehicle Miles Traveled, a national average fuel efficiency, and an average emissions factor per gallon of gasoline. This per household measure divides the total block group emissions by the count of households.
Potential uses: This is a very useful map because it shows that location efficeincy allows household to contribute less GHGs.
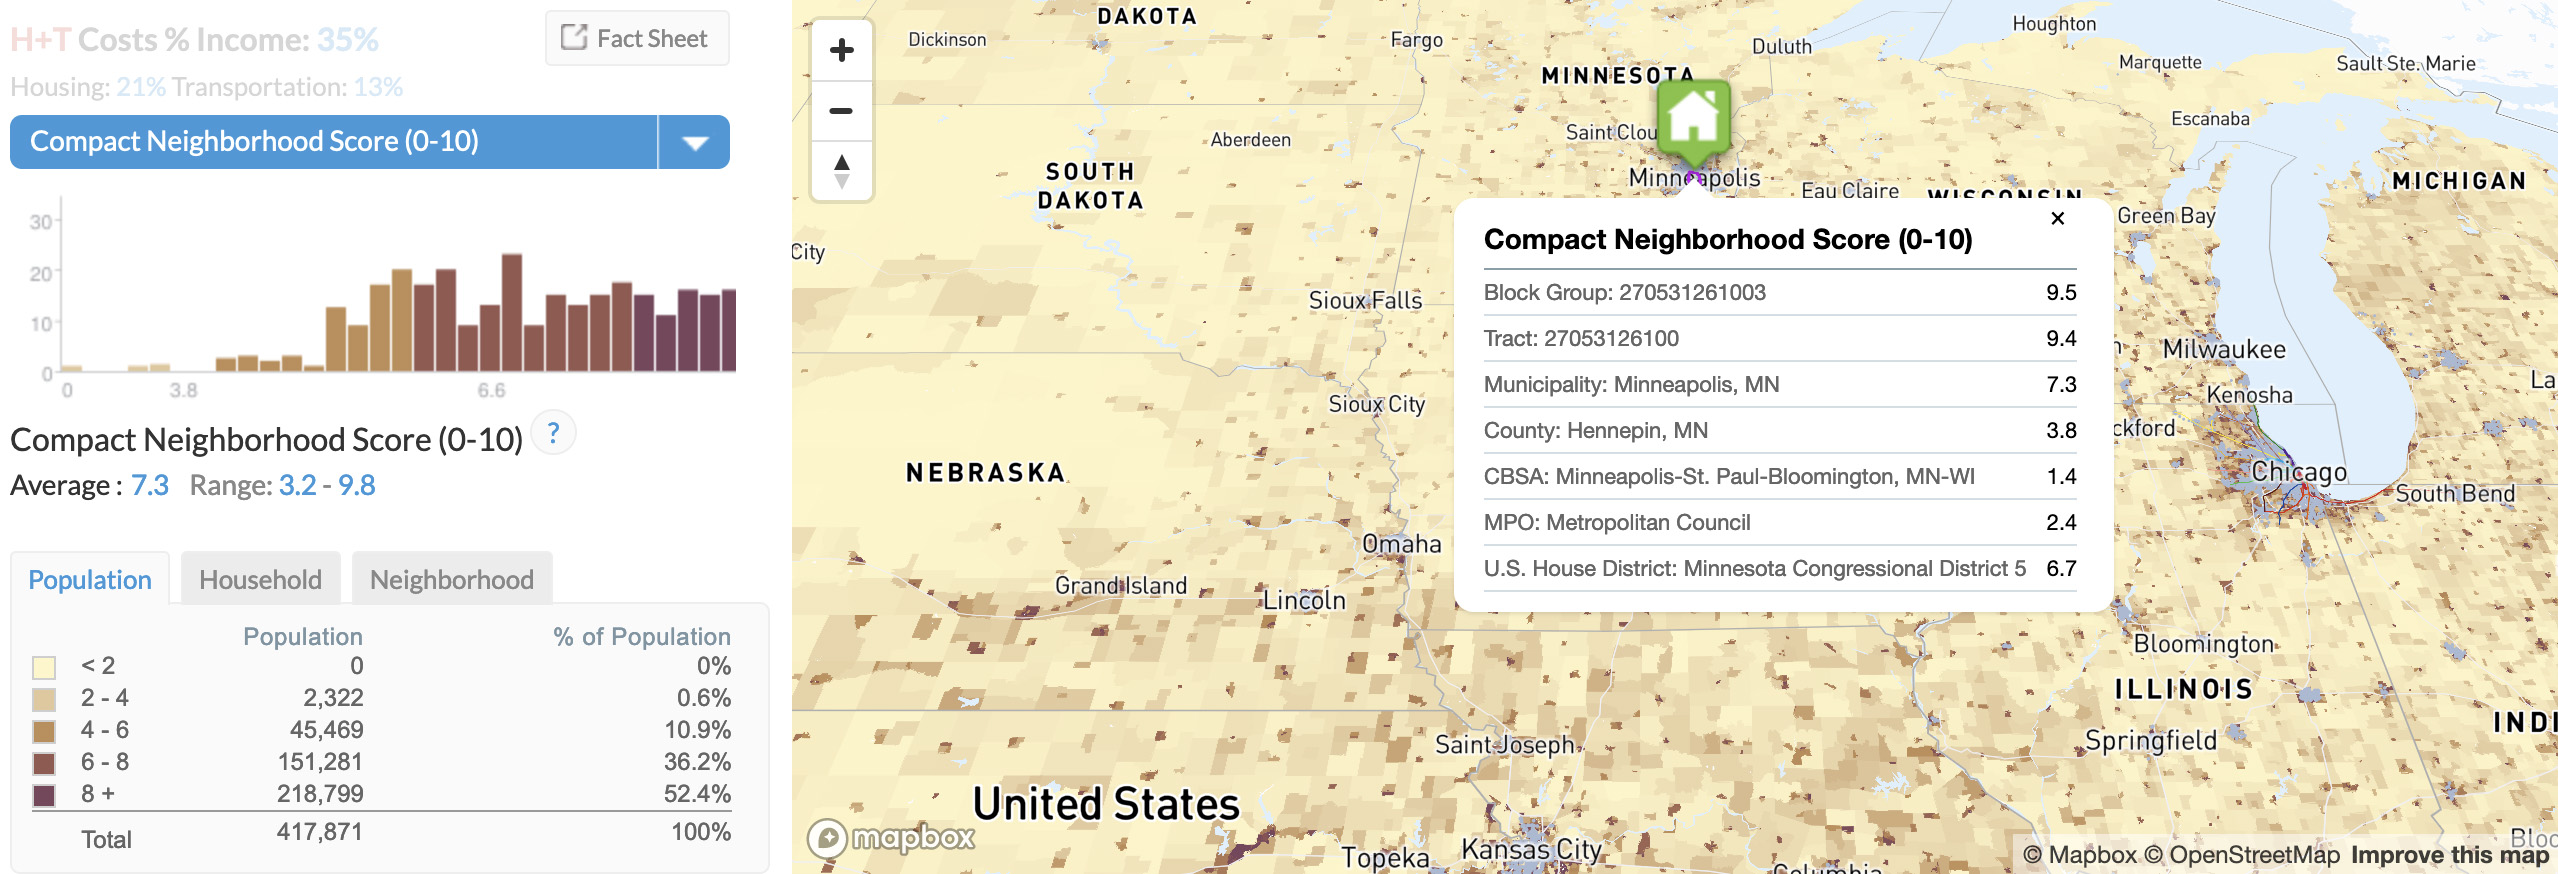
Composite Neighborhood Scores
Compact Neighborhood Score (0-10): An index based on the build environment, included in the ranking are: block size, fractions of single family detached (SFD) dweling units(DU), intensity of SFG DUs, gross household density, household intensity, percent of renter households, and intesity of rental hsoueholds.
Potential uses: This score is national in scope, 10 is set for the location where all of the built environment comes together to enable households to live with less dependacy on cars to get everyday life done. Thus user can see where there may be location that could use an upgrade.
Environmental Characteristics
Average Block Size: Average Block Size, calculated in acres, is the average size of all the blocks making up a given Block Group.
Potential uses: This factor has been included as a potential indicator of walkability in an area, with smaller blocks contributing to a more desirable walking environment. Many previous indicators of walkability have focused on what destinations are in the area, but this metric really provides insight into how easy it is to walk around in the neighborhood.
View the appendix at the bottom of this page to see a full list of the 37 metrics and their definitions.
But Wait, There's More!
Here are some useful features and pro tips you may not know about.
1. Choosing a Household Type
The H+T Index uses the “Regional Typical Household” to highlight location efficiency, but the tool also allows you to select any of the three different household types available:
- Regional Typical
- Regional Moderate
- National Typical
Explore these to see how costs vary by household income and size for 3 different household types. If you’re wondering why the H+T uses the Regional Typical, we wrote a blog on exactly that topic because it’s something we’re asked about all the time.
2. Changing the Geographic Scope
Pro Tip: You can click on the green map marker to view and compare the currently selected metric for all available geographies from the block group and tract levels, all the way to County and Municipality if available. You can also click and drag this map marker to examine another location on the map.
Whether you initially entered a specific address, zip code, city/town, county, metropolitan area, or something else, a green map marker will appear on the map at your selected location. Did you know you can drag that map marker anywhere else to quickly shift to another place nearby, or anywhere else in the United States?
You can also change the geographic scope using the drop-down menu and choose from the following:
- U.S. Census Block Group
- Tract
- Place
- County
- CBSA
- Congressional District
- MPO
3. Examining a Metric’s Distribution
Below the selected metric is more information about what is spatially displayed on the map.
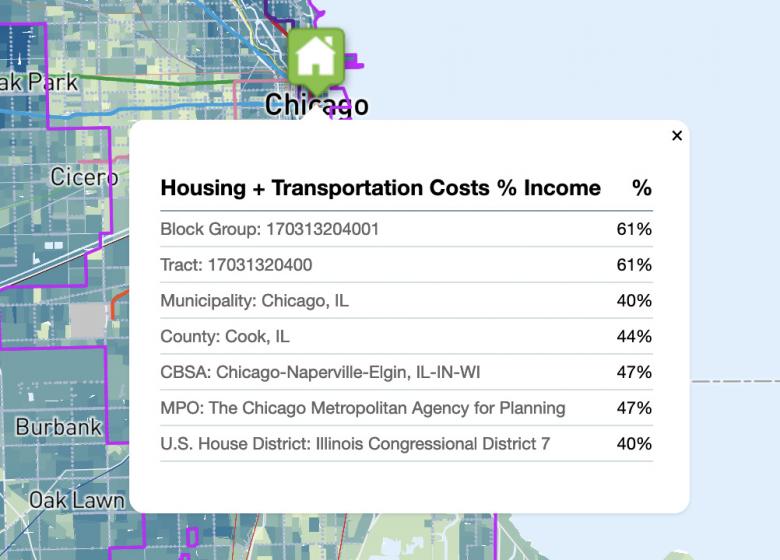
If you choose to look at a specific Census Block Group, the most detailed geographic scope available, you will see the metric's value for that block group and little else (figure 1). But you will also see a list of larger geographic areas covered by the tool that encompass that Census Block Group. Clicking on any of those larger geographies will shift the map's geographic focus and provide further context of a metric's distribution and range within that selected scope.
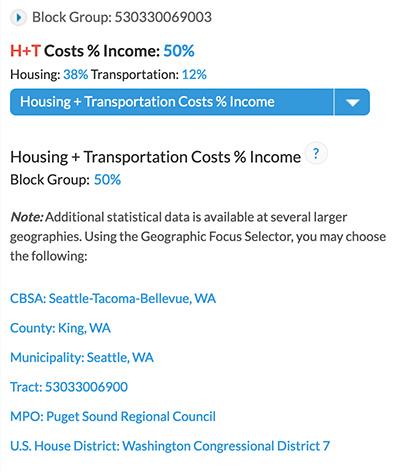
Figure 1: In this case, we're looking at the Housing + Transportation Cost as % of Income for a single Census Bock Group in Seattle Washington. The metric is displayed for that block group and below that it is noted that additional statistical data is available at several larger geographies which encompass the block group and are listed below.
Let's say we look beyond a single Census Bock Group by selecting its Municipality. By examining a geographic area larger than a block group, you will also see a histogram bar chart and more detail (figure 2). At any of these larger geographies a "Fact Sheet" button will appear and lets you jump to a 2-page overview of the location you have selected.
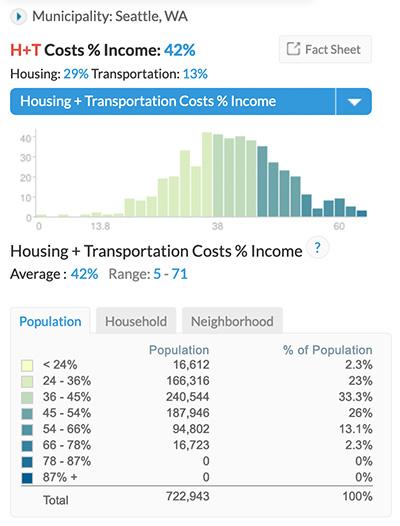
figure 2: This chart displays the number of block groups within the geographic scope, for bins of the metric. Below the graph the average and the range of the metric in the chosen geography is listed and you will also see a set of tables, of the frequency distribution for population, households, and neighborhoods (as defined by Census Block Groups).
Pro Tip: Clicking on the low and high end of the range gives lists of the top 5 and bottom 5 Census Block Group for the selected metric. You can click on any of those block groups to move the map marker to that block group. And by clicking on the green map marker on the map you can see the average value of the metric for all the various geographical areas that that Census Block Group is within.
Note that each bin in the graph represents approximately 1/30th of the range. In the case shown above each bin has a range of approximately 2.8 percentage points. In the graph above, the bin with the most Census Block Groups is in the range of 35.2% to 38% where there are 40 Census Block Groups.
By default, the Population table is shown but by clicking on the Household / Neighborhood tabs you can see those frequency distributions as well.
Bonus Mapping Tools
The light green menu bar at the top of the site gives the user even more options.
The H+T Fact Sheet creates a summary of the H+T Index for a location such as a municipality, county, metropolitan area, etc. Total Driving Costs estimates the household cost of driving for a typical household in the chosen location and allows you to change the price of gas to explore how that will change those costs. Users can create side by side maps using the Comparison Maps menu item, where they can look at Two Views of Affordability, how Greenhouse Gas Emissions from driving vary, and create their own Custom Comparisons. And you can always just download the H+T data and metrics for various geographical areas from the Download Data page. The About menu item gives the user options to read About the Index, see some Application for Use, they can select the User Guide that will explain how to use the site in more detail, find answers to FAQs and look up items in the Glossary of Terms.
Summary
As you can see there are a lot of features to the H+T Index webtool beyond the Index itself. We really encourage users to spend some time exploring the options listed in this blog post. By doing so you can learn a lot about your community.
Here are some of the subjects this series of blogs will cover in current and future posts:
- The H+T Index – an introduction and overview
- Why do we use the regional typical household?
- So, what else can I do with the H+T Index?
- A look under the hood of the transportation model
- H+T’s relevance and policy implications
- What did we learn from the results from our H+T User survey?
- Connecting H+T to ETOD (Equitable Transit Oriented Development)
- The future – equity and affordability
Appendix: Defining All 37 of the H+T Index Metrics
Affordability Indices
Housing + Transportation Costs % Income: H+T has been developed as a more complete measure of affordability beyond the standard method of assessing only Housing Costs. By taking into account both the cost of housing as well as the cost of transportation associated with the location of the home, H+T provides the true cost of housing decisions. Dividing these costs by the representative income illustrates the Cost Burden placed on a Typical Household by combined H+T expenses.
Housing Costs % Income: Housing Costs factored as a percent of income has widely been utilized as a measure of affordability. Traditionally, a home is considered affordable when the costs consume no more than 30% of household income.
Transportation Costs % Income: Household Transportation Costs are calculated as the sum of Auto Ownership Costs, Auto Use Costs, and Public Transit Costs. Dividing these costs by the representative income illustrates the Cost Burden placed on a Typical Household by Transportation Costs.
Household Model Outputs
Autos per Household: Autos per Household models the average number of vehicles owned by households, as modeled for the typical household, within the Block Group.
Annual Vehicle Miles Traveled per Household: Vehicle Miles Traveled represents the average annual auto travel as modeled for the typical household. This includes commute travel, but also all other daily auto trips.
Transit Ridership % of Workers: Transit Ridership represents the percentage of workers in a Block Group who utilize public transportation as their primary mode of transportation to work, as modeled for the typical household.
Annual Transportation Cost: Transportation Costs represent the average total cost of household transportation. Here, transportation costs are defined as the sum of auto ownership costs, auto use costs, and public transit costs, as modeled for the typical household.
Annual Auto Ownership Cost: Auto Ownership Costs have been defined as the cost of depreciation, finance charges, insurance, license, registration, and taxes (state fees) per auto. These costs are largely fixed, less determined by use, and therefore, a result of simply owning an automobile.
Annual VMT Cost: Annual VMT Costs are calculated using modeled VMT and have been defined as the cost of gas, maintenance, and repairs per mile. These costs are largely variable and therefore determined primarily based on the level of use of the automobile.
Annual Transit Cost: Annual Transit Costs are calculated using figures obtained from the National Transit Database. This component of total Transportation Costs factors the average cost of transit use per household using the regional average price.
Annual Transit Trips: Average Annual Transit Trips as modeled for the typical household. This is calculated using the transit agencies total trips provided allocated to all the Census Block Groups they provide service to, proportiatly using the number of households and the modeled transit ridership % of workers.
Greenhouse Gas from Household Auto Use
Annual GHG per Household: Greenhouse gas emissions from household auto use are calculated using the modeled values for Vehicle Miles Traveled, a national average fuel efficiency, and an average emissions factor per gallon of gasoline. This per household measure divides the total block group emissions by the count of households.
Annual GHG per Acre: Greenhouse gas emissions from household auto use are calculated using the modeled values for Vehicle Miles Traveled, a national average fuel efficiency, and an average emissions factor per gallon of gasoline. This per acre measure divides the total block group emissions by the total land acres in the block group.
Composite Neighborhood Scores
Compact Neighborhood Score (0-10): Index based on the build environment, included in the ranking are: block size, fractions of single family detached (SFD) dweling units(DU), intensity of SFG DUs, gross household density, household intensity, percent of renter households, and intesity of rental hsoueholds.
Job Access Score (0-10): Index based on employment location and variety of employment types.
AllTransit Performance Score (0-10): Overall transit index that looks at connectivity, access to land area and jobs, and frequency of service.
Environmental Characteristics
Residential Density 2010: Residential Density, defined here as the weighted average block Gross Household Density for all the blocks in the block group. This indicator has been found to be one of the important environmental variables that determine household Transportation Costs. In areas of high density, Transportation Costs tend to be lower than in areas of low density. However, the measure has to be made at the Census Block Scale and those data are only available for the decennial census. So, we do not use this variable in modeling household transportation behavior for 2019.
Gross Household Density: Gross Household Density is defined as total household per total land acre.
Percent Single Family Detached Households: Percent of households living in single family detached housing units.
Regional Household Intensity: Sum of all households not in Block Group weighted by one over the distance squared.
Employment Access Index: The Employment Access Index is a weighted measure developed by CNT to estimate both the quantity of and residents’ access to the jobs in a region.
Employment Mix Index (0-100): Employment Variation Index is based on employment type and looks at various industries and how they drive transportation costs.
Transit Connectivity Index (0-100): The Transit Connectivity Index (TCI) was developed by CNT as a measure of transit service levels. The TCI is based on the number of bus routes and train stations within walking distance for households in a given Block Group scaled by the Frequency of Service.
Transit Access Shed: The Transit Access Shed is defined as the optimal accessible area from any block group within 30 minutes by public transportation.
Jobs Accessible in 30 Minute Transit Ride: Count of jobs accessible within a 30-minute transit ride.
Available Transit Trips per Week: Number of possible transit rides within the block group of within 1/4 mile of its border.
Average Block Perimeter: Average perimeter of the Blocks by Block Group
Average Block Size: Average Block Size, calculated in acres, is the average size of all the blocks making up a given Block Group. This factor has been included as a potential indicator of walkability in an area, with smaller blocks contributing to a more desirable walking environment.
Intersection Density: For each block group, the sum of all intersections (including those on the borders) is calculated and divided by the total land area of the block group.
Household Charateristics
Median Household Annual Income: Median Household Income includes the income of the householder and all other individuals 15 years old and over in the household, whether they are related to the householder or not. This value represents the median income within a Block Group.
Average Household Size: Average Household Size is defined as the total population living in households per the count of households.
Average Commuters per Household: Average commuters per household is calculated using the total workers 16 years and over who do not work at home from the American Community Survey. Because this variable includes workers not living in housing units (i.e. those living in group quarters), the ratio of total population in occupied housing units to total population was used to scale the count of commuters to better represent those living in households.
Housing Costs
Average Monthly Housing Cost: Average housing costs are derived directly from the American Community Survey. Median Selected Monthly Owner Costs and Median Gross Rent are averaged and weighted by the ratio of owner- to renter-occupied housing units from the Tenure variable.
Median Selected Monthly Owner Costs: Median Selected Monthly Owner Costs are used directly from the American Community Survey and represent the median monthly costs of owners with a mortgage.
Median Gross Monthly Rent: Median Gross Rent is used directly from the American Community Survey and represents the median monthly costs for renters paying cash rent.
Percent Owner Occupied Housing Units: Percent owner occupied housing units is used directly from the American Community Survey from the Tenure variable and represents the share of owner-occupied housing units of all occupied housing units.
Percent Renter Occupied Housing Unit: Percent renter occupied housing units is used directly from the American Community Survey from the Tenure variable and represents the share of renter occupied housing units of all occupied housing units.
 RSS Feed