


Flood Equity Report
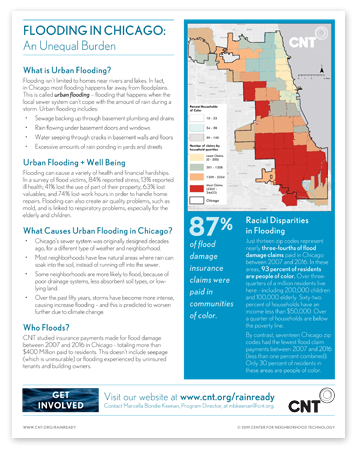
CNT studied insurance payments made for flood damage between 2007 and 2016 in Chicago - totaling more than $400 Million paid to residents. The flood equity report assesses disparities of urban flood risk for households of color in Chicago.
Download:
Fact Sheet | Full Report
Interactive Map:
Flood Equity Map
Who Floods?
Each of the four colors in the map below represent approximately one-fourth of the city’s households (also called quartiles), grouped by zip codes. Urban flooding affects them very differently. The zip codes are ordered by the number of claims from high to low – red representing zip codes with the most claims, followed by orange, green and yellow.
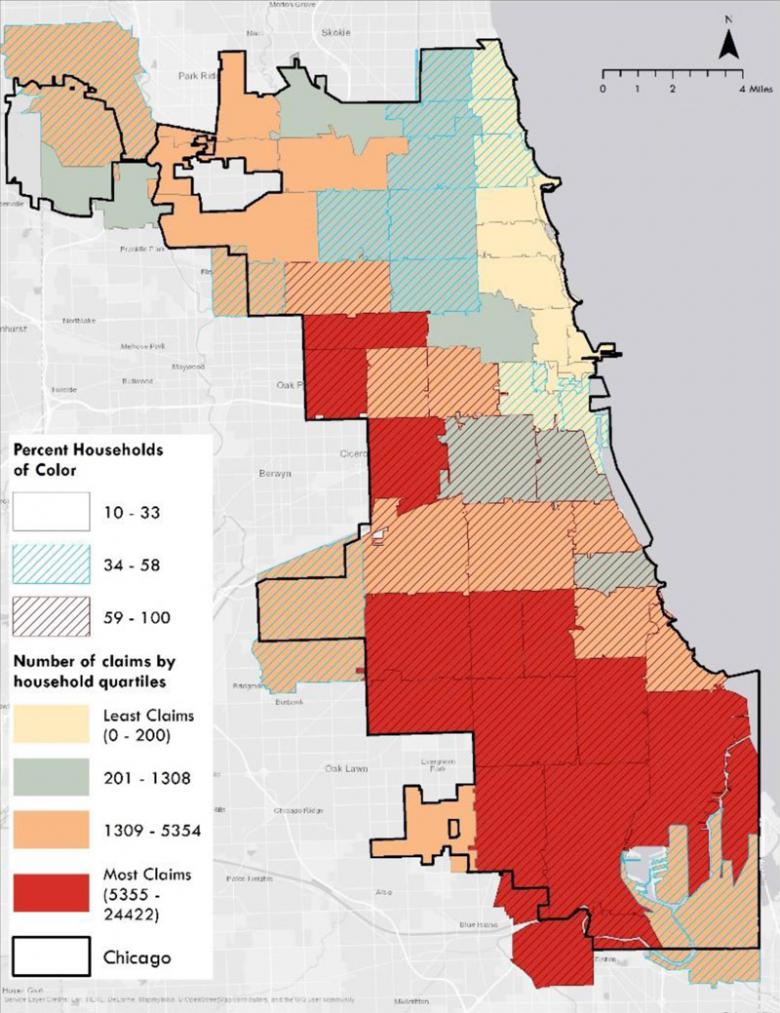
For every 1,000 households living in zip codes with the highest number of claims, 644 claims were made between 2007 and 2016. That is 4 times more than the quartile with the second highest number of claims and 200 times more than zip codes with the fewest claims.
These neighborhoods also face higher levels of poverty and have lower incomes than the city average. Nine out of ten households residing here are households of color. And 38% of the city’s households of color live here, highlighting the unfair burden experienced by neighborhoods already combating economic disparity.
Interactive Flood Equity Map
The interactive map below shows the racial disparities in flooding by zip code. Click a location on the map to view underlying flood statistics within that zip code. You may also search for an address or zip code to locate a specific place of interest.