Interactive Map
The interactive map below shows the racial disparities in flooding by Chicago zip code. Click a location on the map to view underlying flood statistics within that zip code. You may also search for an address or zip code to locate a specific place of interest.
Racial Disparities in Flooding
Just thirteen zip codes represent nearly three-fourths of flood damage claims paid in Chicago between 2007 and 2016. In these areas, 93 percent of residents are people of color. Over three-quarters of a million residents live here - including 200,000 children and 100,000 elderly. Sixty-two percent of households have an income less than $50,000. Over a quarter of households are below the poverty line.
By contrast, seventeen Chicago zip codes had the fewest flood claim payments between 2007 and 2016 (less than one percent combined). Only 30 percent of residents in these areas are people of color.


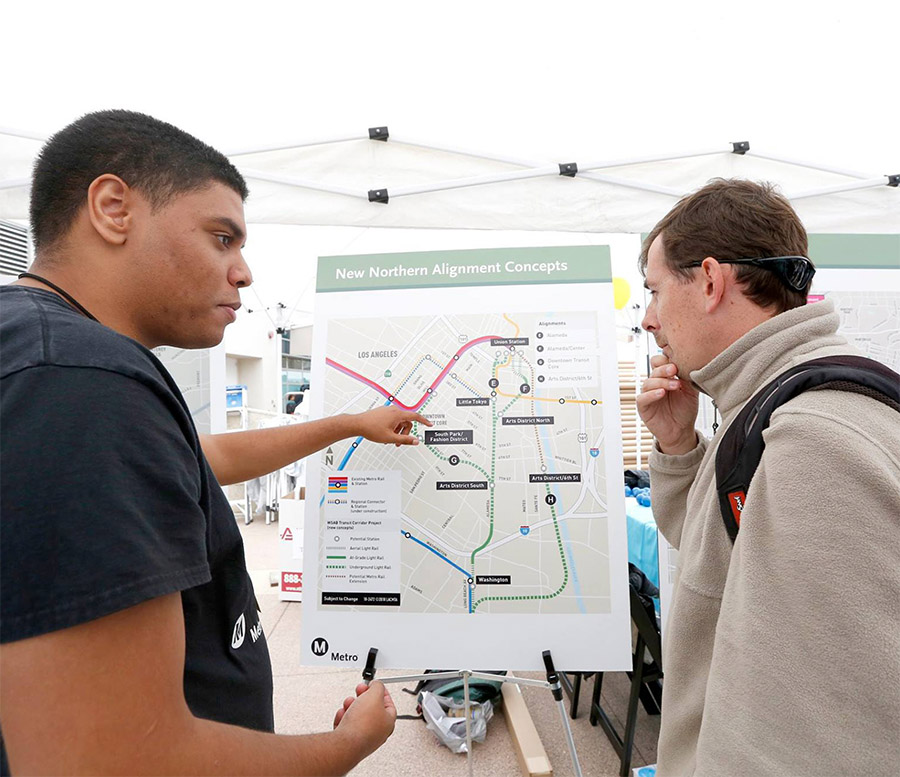
 Strengthening Transit Through Community Partnerships

